

|
Insights Applied to Climate Modeling.
Prediction of Monthly Global Temperatures. Last Update.
|
In May 2011 we developed a global system model of the atmosphere by our Insights app that has been published at Climate Etc. in October 2011. This model describes a non-linear dynamic system of the atmosphere for decadal monthly forecasting consisting of 5 drivers: Ozone concentration, aerosol index, radiative cloud fraction, and global mean temperature as endogenous variables and sun activity as exogenous variable of the system. The model was built from observational data from October 1988 till April 2011 of up to 1000 input variables with time lags of up to 120 months, which is a typical input space dimension for complex dynamic systems modeling.
We present here an updated validation of the initial ex ante prediction for May 2011 to October 2017 (78 months) of this system model by a comparison of observed temperatures (black/withe square dots; HADCRUT3) vs predicted temperatures (red lines). Both model and ex ante prediction have not been changed since their publication in 2011. However, the HADCRUT3 dataset, a joint data product of the UK Met Office Hadley Centre and the Climate Research Unit at the University of East Anglia, which was used for model building is no longer supported by the providers. Instead, a new version, HADCRUT4, is maintained now, whose values differ from the previous version ones. In order to keep our system prediction up-to-date, we now have to transform HADCRUT4 into HADCRUT3 values, which introduces minor deviations from the original HADCRUT3 data, however. Apart from that, this is real OUT-OF-SAMPLE prediction.
As of December 2017, the prediction accuracy of the most likely prediction (solid red line) of the Insights model is 57%. The accuracy relative to the prediction range (pink area) is 93% (fig. 1).

Fig. 1: Ex ante forecast (most likely (red), high, low (pink); May 2011 - October 2017) of the system model (as of April 2011) vs observed values (black and white square dots; HADCRUT3) from May 2011 to December 2017. Since June 2014 HADCRUT3 is not maintained anymore and, therefore, has to be derived from HADCRUT4 data for compatibility reasons.
The high temperatures from October 2015 to August 2016 are attributed to a weather anomaly of the Pacific Ocean called El Niño, which has been of special intensity this time. El Niño is an irregularly occurring heat event in the central and east-central equatorial Pacific based on complex ocean-atmosphere interactions, which is not fully understood yet and which is affecting the coastal regions of South America, California, and Asia, directly, but also has effects globally.
In comparison, the expensive General Circulation Models (GCMs) which the IPCC AR4 and AR5 projections are based on and which rely on atmospheric CO2 as major climate driver (and which are long-term trend models for 100 years, to be fair), show a prediction accuracy of just 31% for the time period 2007 (the year of publication) till today and 29% for the same time period as the Insights system model (fig. 2).
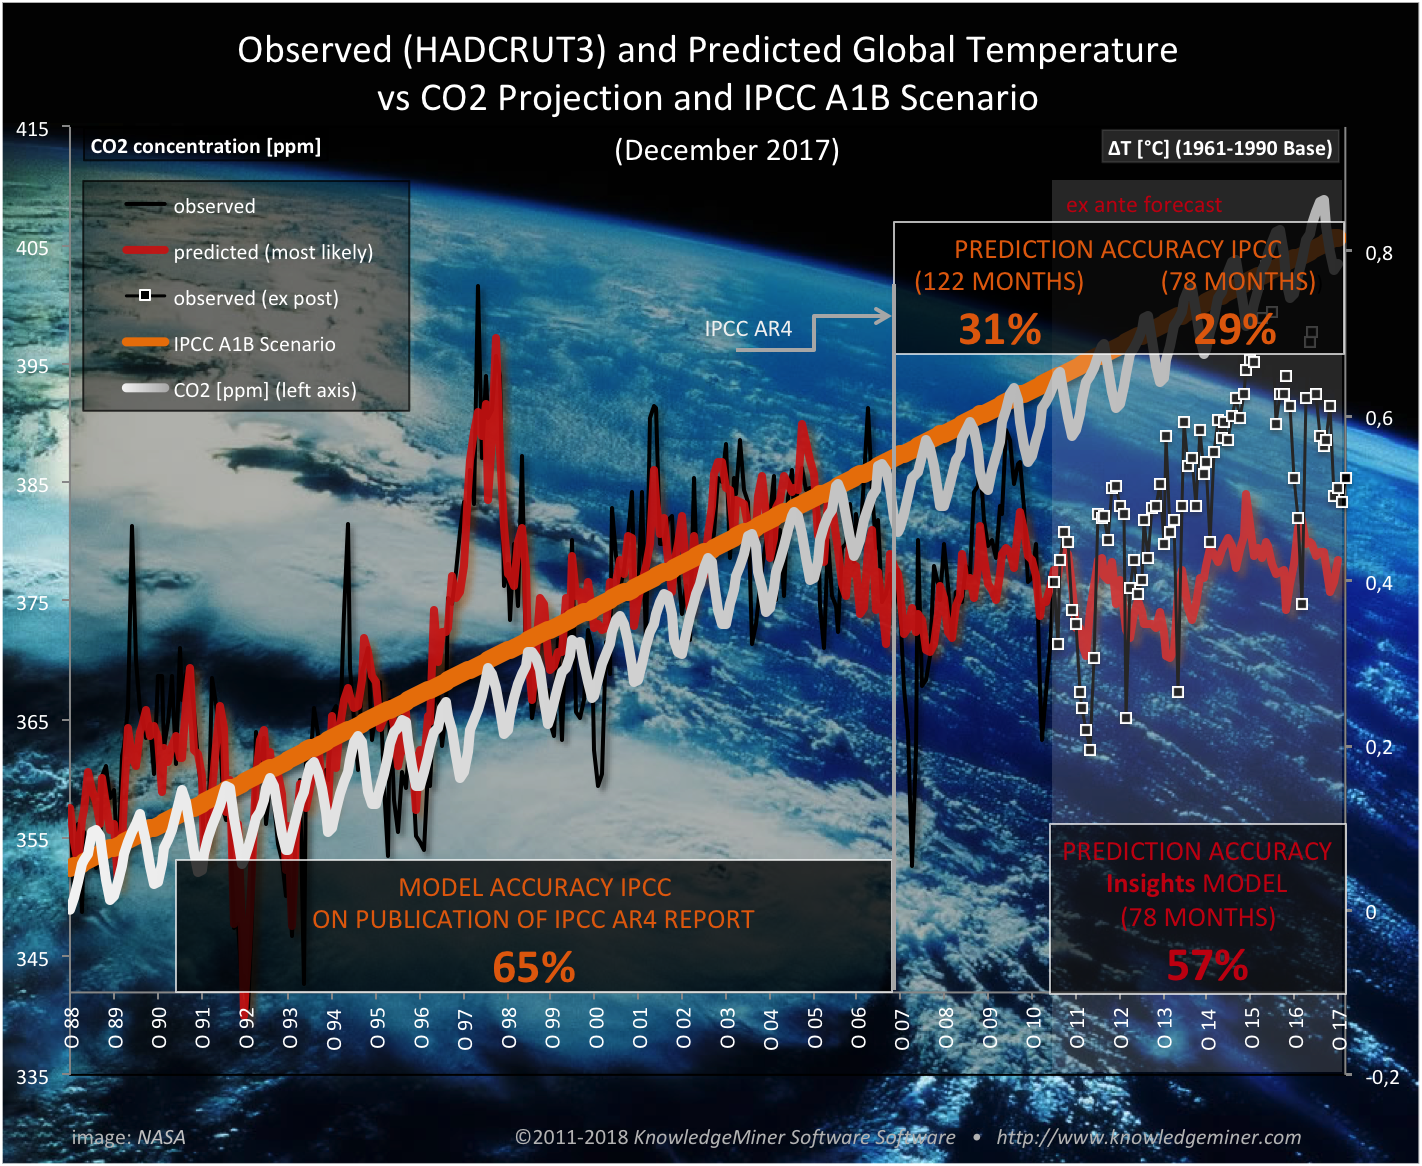
Fig. 2: Ex ante most likely forecast (red; May 2011 - October 2017) of the self-organized system model (as of April 2011) vs observed values (black and white square dots; HADCRUT3) from May 2011 to December 2016 vs IPCC A1B projection (yellow; until October 2017) vs CO2 concentration (light gray; until October 2017). Since June 2014 HADCRUT3 is not maintained anymore and, therefore, has to be derived from HADCRUT4 data for compatibility reasons.
The HADCRUT3/4 as well as the GISS (NASA Goddard Institute for Space Studies) datasets use station based temperature observations, exclusively. Currently, about 2000 ground stations are contributing to these data, and they cover only about 75% of the geographic surface of the earth. Also, these stations are not equally distributed over the globe, which is why complex interpolation methods are used to generate the final HADCRUT/GISS datasets of a regular grid structure of 5°x5° spatial resolution, which introduce considerable uncertainty in the provided temperature data.
In contrast, there are satellite based temperature observation data of the lower troposphere of which the RSS (Remote Sensing Systems) and UAH (University of Alabama in Huntsville) datasets are the most prominent ones. They show higher spatial resolution, cover over 98% of the earth's surface, and they do not use interpolation techniques for spatial grid correction (though they have to apply calibration methods for consistency of the datasets), which improves data quality and reliability.
A comparison of the ex ante system prediction with these observed satellite data (average of RSS and UAH) shows a higher forecasting accuracy of currently 59% and almost no bias of the most likely predictions, with the exception of the extreme El Niño and post-El Niño weather event in 2015-2017 (fig. 3). Also, it is shown that the IPCC A1B forecast is above the observed temperature data most of the time, and it overestimated the temperature development over the past 10 years, except for few months of the El Niños of 2009/10 and 2015/16.
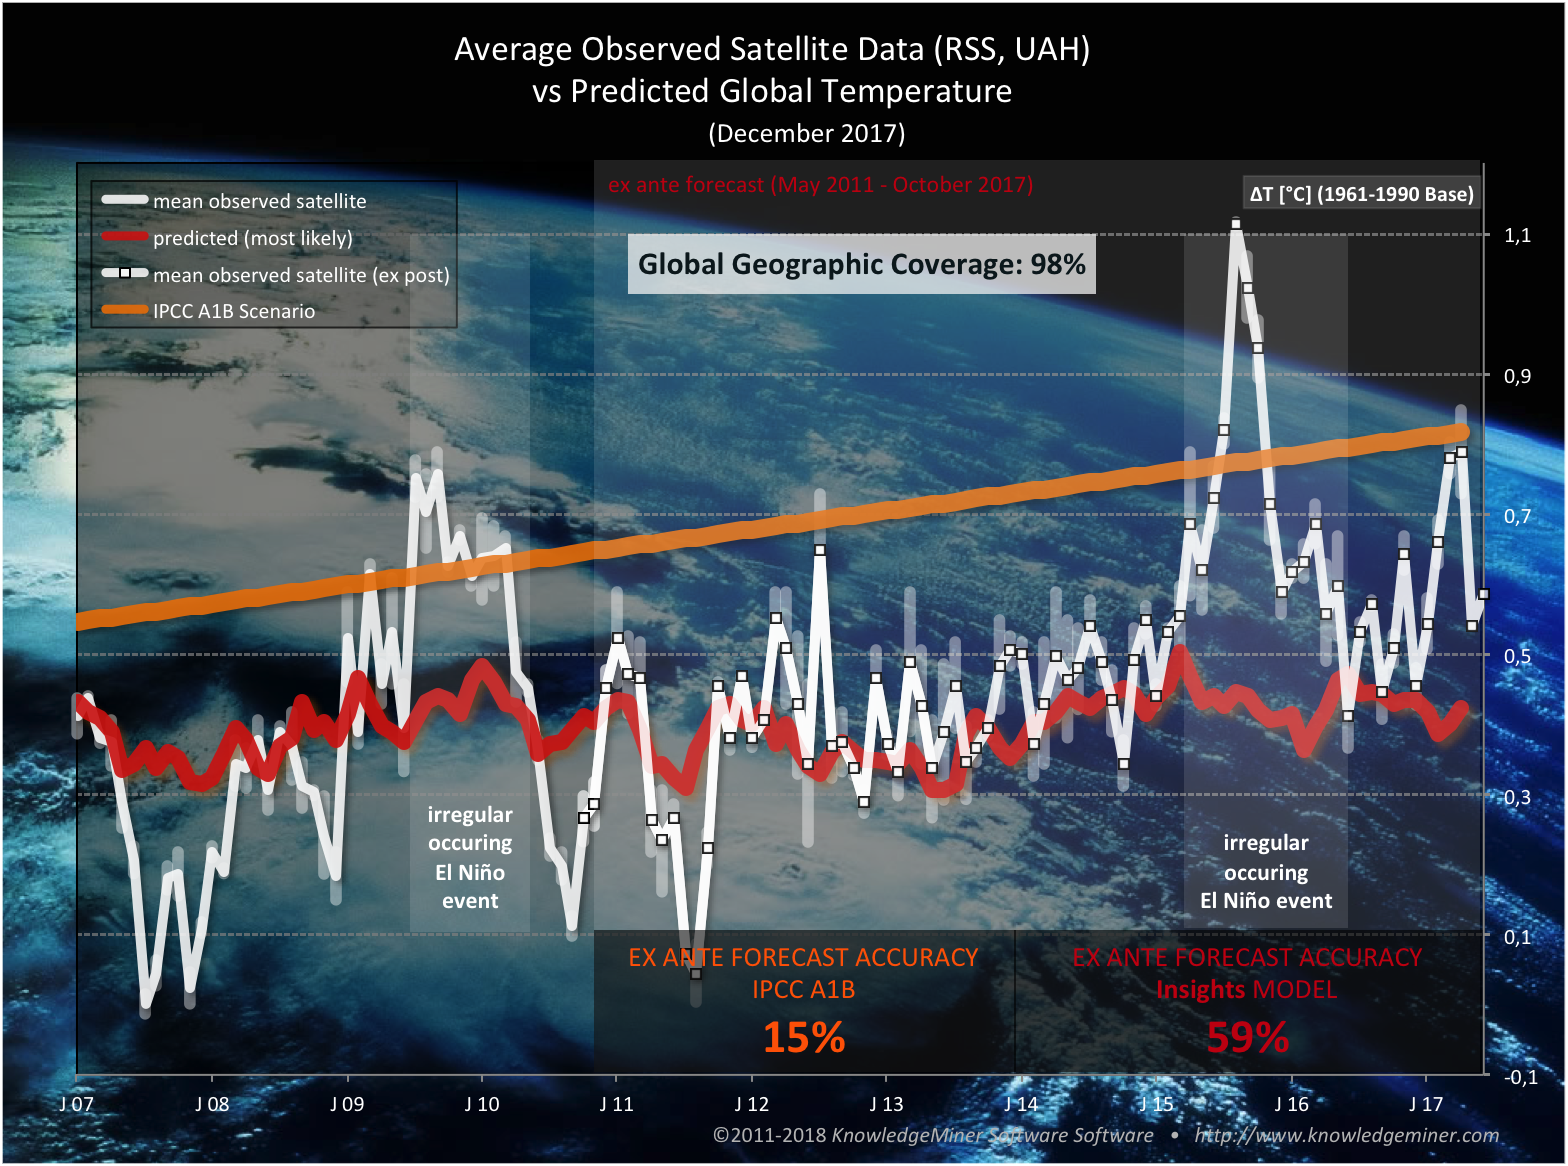
Fig. 3: Ex ante most likely forecast (red; May 2011 - October 2017) of the self-organized system model vs observed satellite data (black and white square dots; average of RSS and UAH) from May 2011 to December 2017 vs IPCC A1B projection (yellow; until October 2017). It shows a forecasting accuracy of currently 59%.
In 2013 the UK Met Office started to publish their decadal forecast based on yearly data, which they both model and forecast update and correct every year. This forecast can be found here.
The demonstrated high predictive power of the self-organized Insights system model is clearly a result of the ability of the implemented inductive modeling technology to autonomously and reliably extract relevant information from the noisy observational data for modeling the internal workings of the ill-defined climate system than theory-driven modeling approaches can achieve based on incomplete and uncertain human knowledge about the system. (Read more about inductive self-organizing modeling and ill-defined systems in the references included in the free download package.)
"A major difficulty in modeling complex systems in such unstructured areas as economics, ecology, sociology, and others is the problem of the researcher introducing his or her own prejudices into the model. Since the system in question may be extremely complex, the basic assumptions of the modeler may be vague guesses at best. It is not surprising that many of the results in these areas are vague, ambiguous, and extremely qualitative in nature.
"The idea is to have the computer construct a model of optimal complexity based only on data and not on any preconceived ideas of the researcher; that is, by knowing only simple input-output relationships of the system, [the] algorithm will construct a self-organizing model that can be used to solve prediction, identification, control synthesis, and other system problems."
-- Stanley J. Farlow, 1981, in: "The GMDH Algorithm of Ivakhnenko."
